 VitaFlowHospital pharmacy
Analytics
Figures with their method.
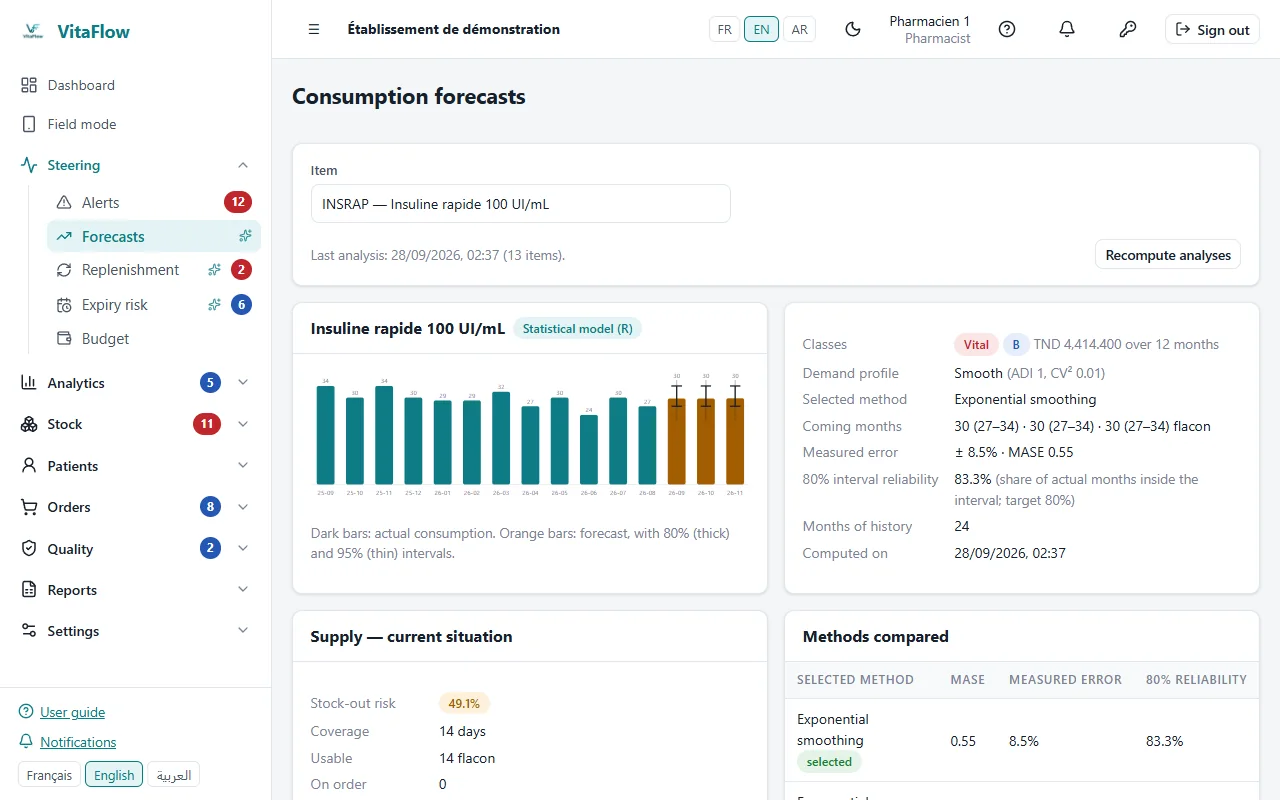
An R statistical engine, isolated and read-only on the data, computes forecasts and risks every night; the application combines them live with current stock.
Forecasting demand and stock-out risk
Demand profile identified for each item: smooth, erratic, intermittent or lumpy.
Several methods compared by validation on the history (exponential smoothing, ARIMA, Croston…); 80% and 95% prediction intervals.
Supplier lead times measured on receipts; stock-out risk and reorder point recomputed on every movement, at the chosen service level.
Anticipating expiry
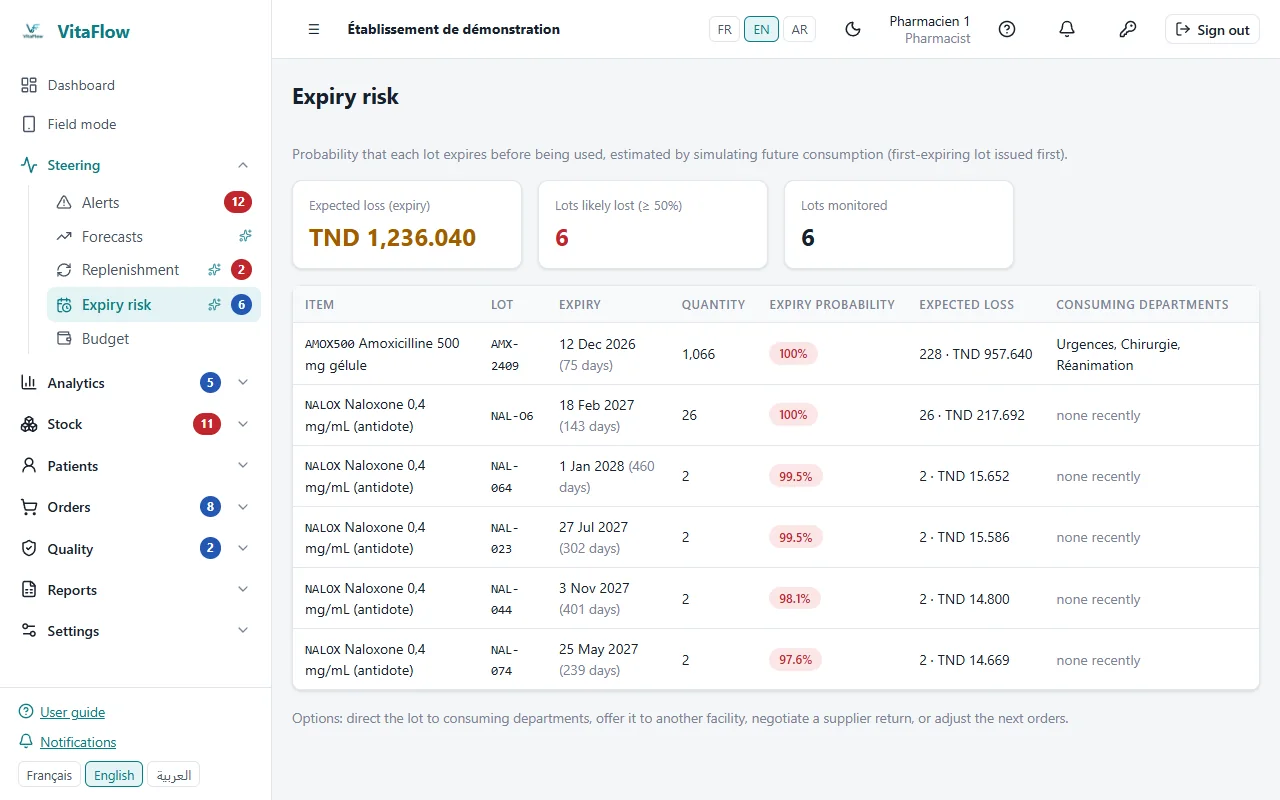
Lot-by-lot simulation of future consumption to estimate the probability of expiry and the expected loss.
Lots at risk are offered for transfer to establishments that will use them in time.
ABC-VEN classification
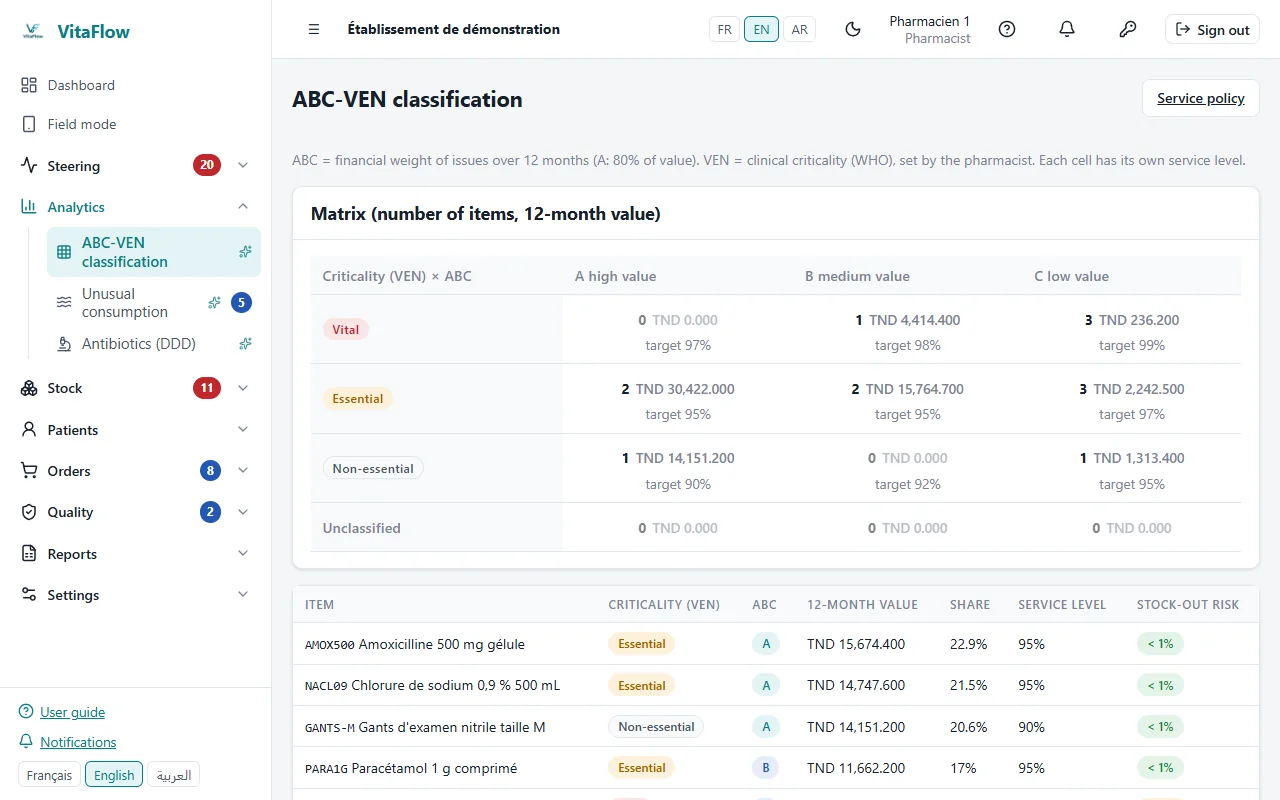
Cross-classification of consumed value (ABC) and clinical criticality (vital, essential, non-essential).
A target service level per class, driving reorder points.
Monitoring consumption
Consumption peaks and drops by item and ward, to be checked.
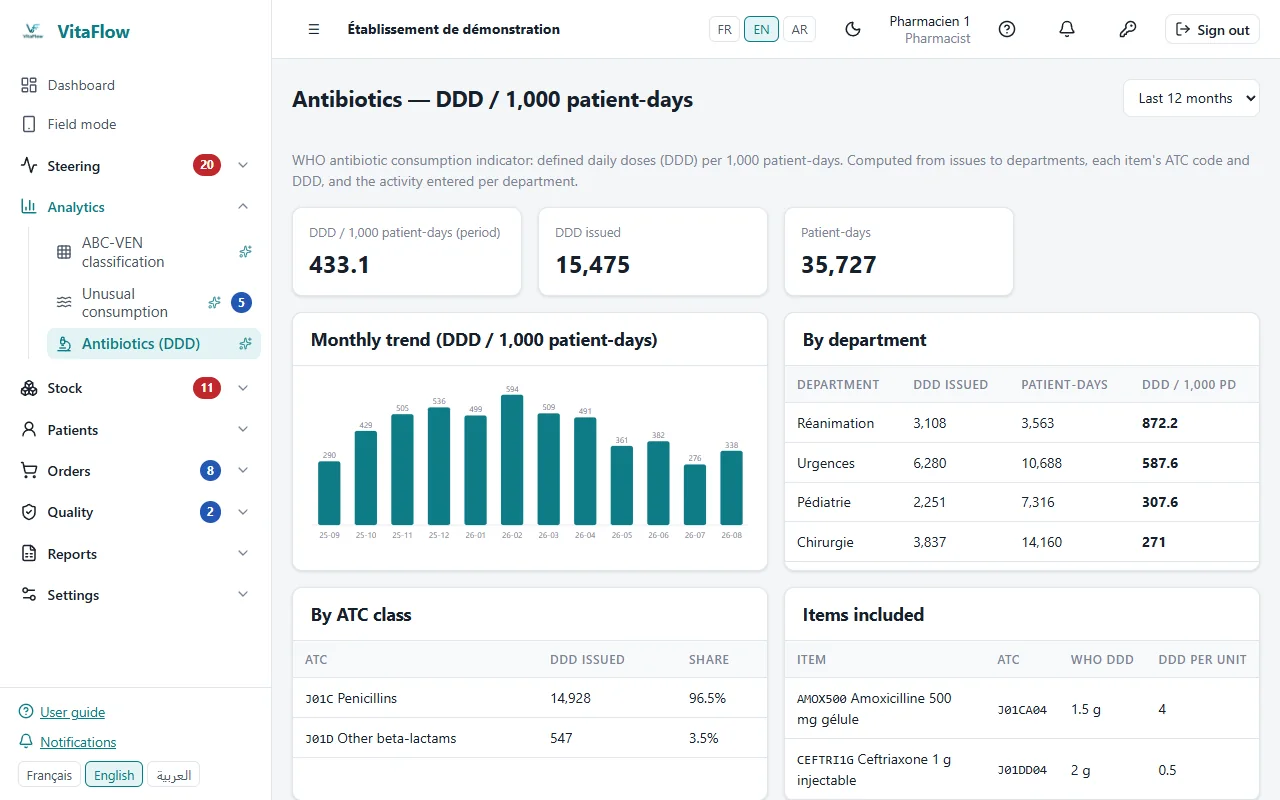
Antibiotic use in WHO defined daily doses per 1,000 patient-days.
Principles
- TransparencyEvery indicator shows its method and calculation period.
- ContinuityIf the R engine is unavailable, a Python fallback takes over, and the screen says so.
- RestraintNo threshold or target is invented: targets are the establishment's own.
See VitaFlow with your data
Guided demonstration, migration of your data by Excel import, installation on your infrastructure.